
Inditex is one of the world’s largest fashion retailers. It has eight retail formats or brands (Zara & Zara Home, Pull&Bear, Massimo Dutti, Bershka, Stradivarius, Oysho and Uterqüe) which sell their collections in 202 markets over an integrated offline-online store network. As of year-end 2018, it had a network of 7,490 stores and was selling its fashions online in 156 markets.
In its annual report, Pablo Isla, current Inditex Chairman, said “2018 was a very important year for the Inditex digital transformation strategy, which has been underway for several years now. We are on course to deliver the vision we set out for Inditex in 2020: a sales platform that is fully integrated (physical points of sale fully interconnected with our online outlets); fully sustainable (with all our stores meeting our eco-efficiency standards); and fully digital (with all our products available online in any corner of the world).”
Last year, we described some of Inditex performance ratios including competitors such as H&M, GAP Inc. and Fast Retailing in The State of Global Fashion Retailers. The spanish fast-fashion retailer keeps growing and we have analysed its 2018 financial results while offering a historical perspective on its key operational finance ratios.

To understand the business model of Zara we recommend Fast Fashion, the art of liquidity, where we described fashion merchandise cycle, the fashion pyramid and fast-fashion key success factors: information management, sourcing (proximity vs off-shore), inventory management (RFID), logistics (centralized distribution), design (new designs every two weeks), amongst others.
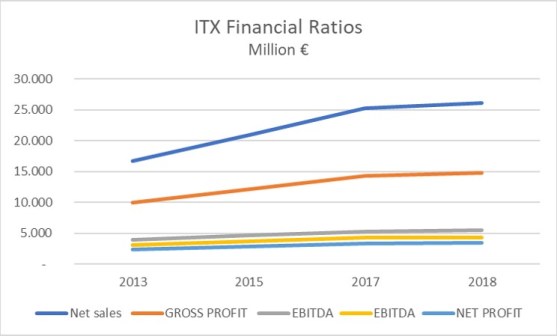
Introducing Inditex 2018 financial results, and as we detail on the income statement, the spanish fashion retailer keeps growing and reached €26.145 Million. This is a +3% growth compared to last year net sales. In summary, we see that Inditex has stable growth and profitability, negative cash conversion ratio , high liquidity (cash) and low leverage.
H&M and Inditex Income Statement ratios comparison

From the income statement, we analise margin by margin and see how Inditex starts with a higher gross margin (57% vs 53% at H&M) and increases the difference compared to H&M until 6 percent points in Net Profit Margin, more than twice. EBITDA is 9 percent points higher at Inditex while EBIT is 10 pp higher.
Inditex is not only buying better but also is more efficient all along the value chain. Inditex base its fast-fashion model in ‘Proximity manufacturing’ to ensure the flexibility and quality required to introduce new designs twice a week. Moreover, 57% of its suppliers are located near shore while most of H&M suppliers are off-shore. But still, Inditex has better deals with their suppliers, even producing in more expensive countries (near-shore: Spain, Portugal, Morocco, Turkey).
In relation to sourcing, on the balance sheet, we see that Inditex has around 70 days of payment compared to 12 at H&M (calc. payables/net sales * 360). The spanish retailer is clearly taking advantage of better payment conditions with its suppliers, so receiving credit from them.

H&M is having issues with a risky sourcing model that obliges them to forecast demand many months in advance and purchase high-volumes of stock in off-shore countries. This is a restriction in terms of flexibility. A formula to shorten collections and create more traffic are the regular capsules that H&M is launching like H&M x Moschino.
Inditex Balance Sheet (2013, 2015, 2017, 2018) – Million €


Need of funds for operations (NFO) are the funds required to finance a company’s operations and it´s the sum of cash, inventory and receivables minus payables. As receivables, inventory and payables depend on sales, as Inditex sales are growing, NFO is growing too. The decrease of NFO between 2017 and 2018 could be explained because the decrease in cash and probably better inventory management.
Working capital (WC), the long-term funding left to finance operations once fixed assets are financed, is also growing and as WC is greater than NFO, there is increasing extra cash. The extra cash, opposite of having a credit need, increased from €385 in 2013 to €2.086 Million in 2018.
Inditex Financial Ratios

Equity keeps growing (+8,5%) compared to last year with €14.683 Million.
It´s not easy to analyze the performance of a company if you don´t know much about the industry or its main competitors. So, I copied the following information from H&M latest annual report to obtain some of the financial ratios of the world second largest fashion retailer. H&M reached revenues of SEK 210.400, or €20.274M (€26.145M at Inditex); Operating Profit of SEK 15.493 or €1.493M and Net Profit of SEK 12.652 or €1.219M.
H&M Financial Results – 2018 Annual Report – SEK M

An interesting ratio is inventory/net sales: 18% percent at H&M versus 10% at Inditex. So H&M is still having issues to sell its stock in an industry where seasonality is one of the main success factors. According to The New York Times, H&M has a $4,3 Billion in unsold clothes (March 2018). A wrong sales forecast, unexpected weather, quality issues, a social media crisis… could reduce inventory turnover and reduce cashflows. H&M inventory is almost two times Inditex one according to their latest balance sheets.
Inventory turnover gives insights on how a company manage costs and sales efficiency. H&M inventory turnover is 2,6 with 136 days of inventory. At Inditex, inventory turnover is 4,2 with 86 days of inventory, as described in table 4. Beyond a better stock management, Inditex seems to take benefit of its fast-fashion business model: short collections sent twice a week to stores, increasing the average number of visits and purchases. More traffic, more demand, less stock and less discounts. On the other hand, H&M sypply chain is way behind Inditex integrated digital supply chain that includes RFID.
Last but not least, in regards Leverage, Inditex has a negative net financial debt (Net Financial Debt – cash / EBITDA ratio = -0,88 in 2018), a clear sign of strength and stability. Investing is not a risk as shown and Inditex is very well positioned to lead the omnichannel era in regards of fashion. If we analyze the same ratio at H&M, its numbers are the following: (in Million SEK) Net Financial Debt is 19.323, Cash is 11.150 and EBITDA is 25.164 (around €2.318M). The ratio NFD-Cash/EBITDA gives 0,3. Even if it´s not as good as Inditex, H&M will be able to decrease its debt and keep investing. A ratio above 4 would set the alarms and it´s not the case.
Our next post will review some retail metrics and detail of Inditex brand portfolio performance.


6 Comments on “Inditex 2018 Financial Results (1)”